 OnCricketBetting
 Cricket Betting Odds & Payout Calculations
 Available in US
Odds are the language of betting. They communicate probability assessments, determine payouts, and reveal where value might exist for those who can read them correctly. Yet many cricket bettors place wagers without truly understanding what the numbers in front of them mean or how to use them for anything beyond calculating potential winnings. This gap between participating in betting and understanding betting creates predictable outcomes: bookmakers profit while uninformed bettors wonder why their cricket knowledge does not translate into results.
The challenge is not that odds are inherently complicated but that they appear in multiple formats designed for different betting traditions. A British punter comfortable with fractional odds may find decimal odds confusing, while an American bettor encounters entirely different notation again. These format differences obscure the underlying simplicity: all odds systems communicate the same information about probability and potential return, just through different numerical expressions.
Beyond format literacy, understanding odds requires grasping concepts like implied probability, margin, and value. These concepts transform odds from mere payout calculations into analytical tools. When you can convert odds to probability estimates, compare those estimates against your own assessments, and identify discrepancies worth exploiting, you have moved from gambling to analytical betting. This transition does not guarantee profits but at least creates the possibility of sustainable edge.
This guide covers everything bettors need to understand about cricket betting odds: the three major formats and how to convert between them, calculating potential winnings under each system, extracting implied probabilities from odds, identifying value opportunities, and understanding how and why odds move before and during matches. Mastering these fundamentals transforms your relationship with betting from passive participation to active analysis.
Types of Global Betting Odds Formats
Decimal Odds Explained
Decimal odds represent the total return per unit staked, including your original stake. Odds of 2.50 mean a winning bet returns 2.50 times your stake: a 10-unit bet returns 25 units total, comprising your original 10-unit stake plus 15 units profit. This format dominates European, Australian, and most international betting markets, making it the most commonly encountered system for cricket betting globally.
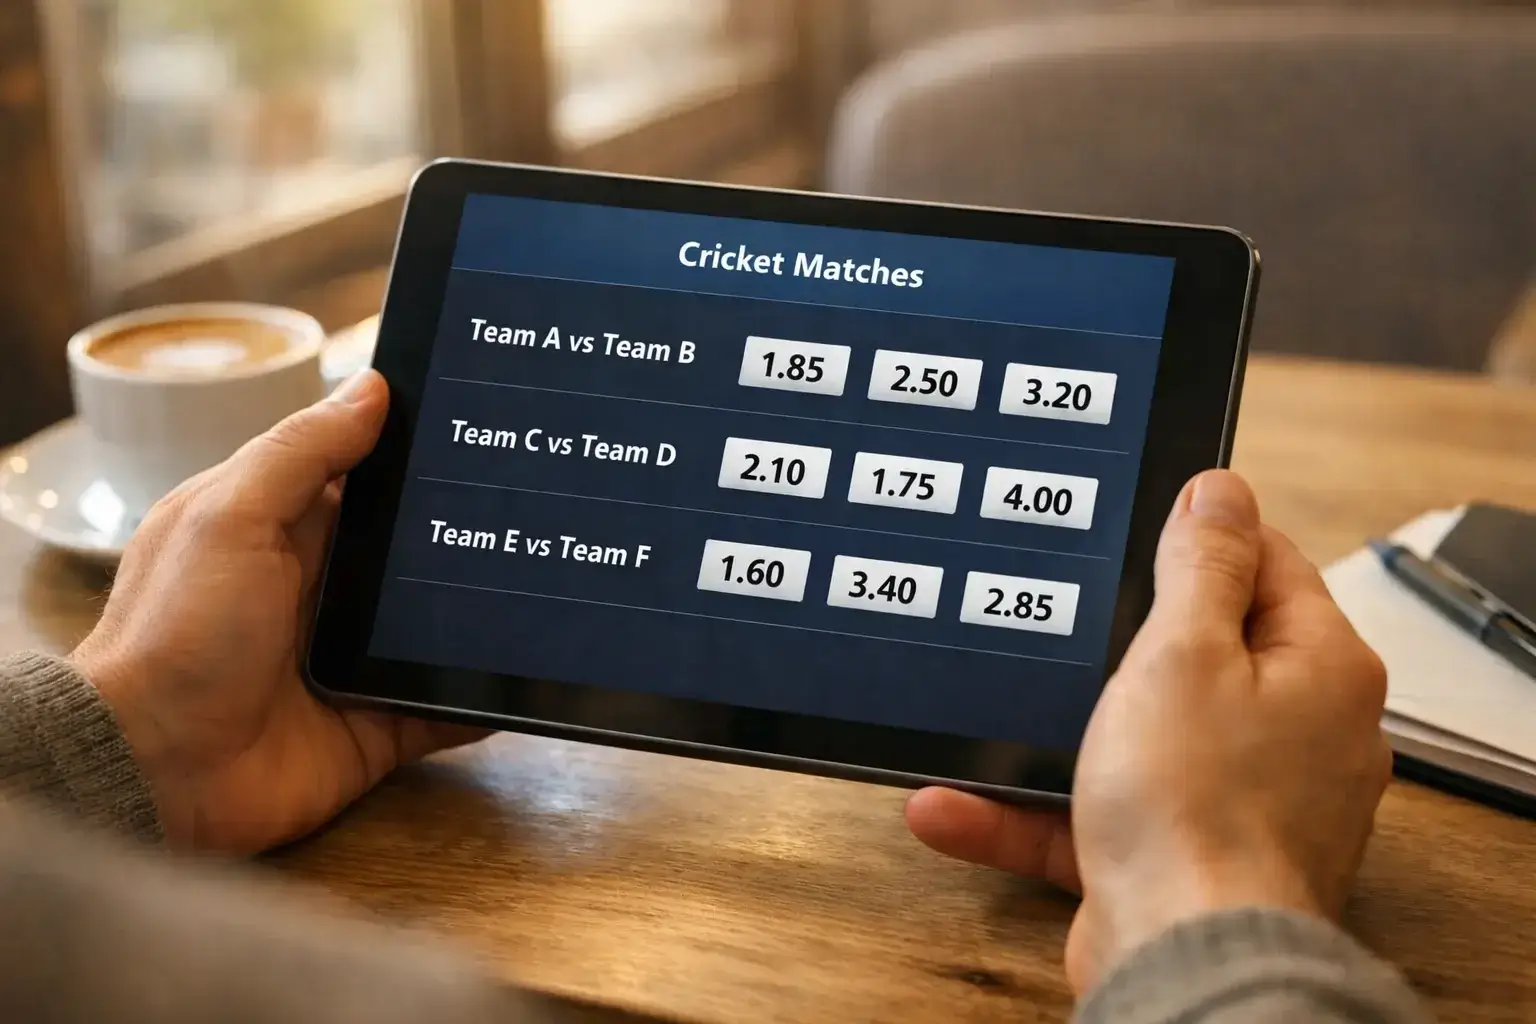
The mathematical elegance of decimal odds lies in their directness. Multiplying stake by odds gives total return. Subtracting stake from return gives profit. No intermediate calculations or fraction manipulations required. This simplicity makes decimal odds particularly useful for comparing options quickly: odds of 3.00 obviously offer better returns than odds of 2.50, which obviously beat odds of 2.00. The visual hierarchy matches the payout hierarchy.
Decimal odds also convert cleanly to implied probability through simple division. The formula involves dividing 1 by the decimal odds: 1 divided by 2.00 equals 0.50, or 50% implied probability. Odds of 3.00 imply 33.3% probability (1/3.00). Odds of 1.50 imply 66.7% probability (1/1.50). This conversion enables comparison between your probability estimates and the market's estimates, the foundation of value betting.
Lower decimal odds indicate higher implied probability and thus favorites, while higher odds indicate lower probability and underdogs. Odds of 1.20 imply the outcome is very likely (83.3% probability), while odds of 10.00 imply the outcome is unlikely (10% probability). The relationship is inverse and intuitive once internalized: the more likely something is to happen, the less the bookmaker will pay you for correctly predicting it.
Fractional Odds Explained
Fractional odds express profit relative to stake as a ratio. Odds of 5/2 mean five units profit for every two units staked, or 2.5 units profit per unit staked. A 10-unit bet at 5/2 returns 35 units total: your 10-unit stake plus 25 units profit (10 multiplied by 5, divided by 2). This format remains standard in United Kingdom betting markets and appears frequently in horse racing worldwide.
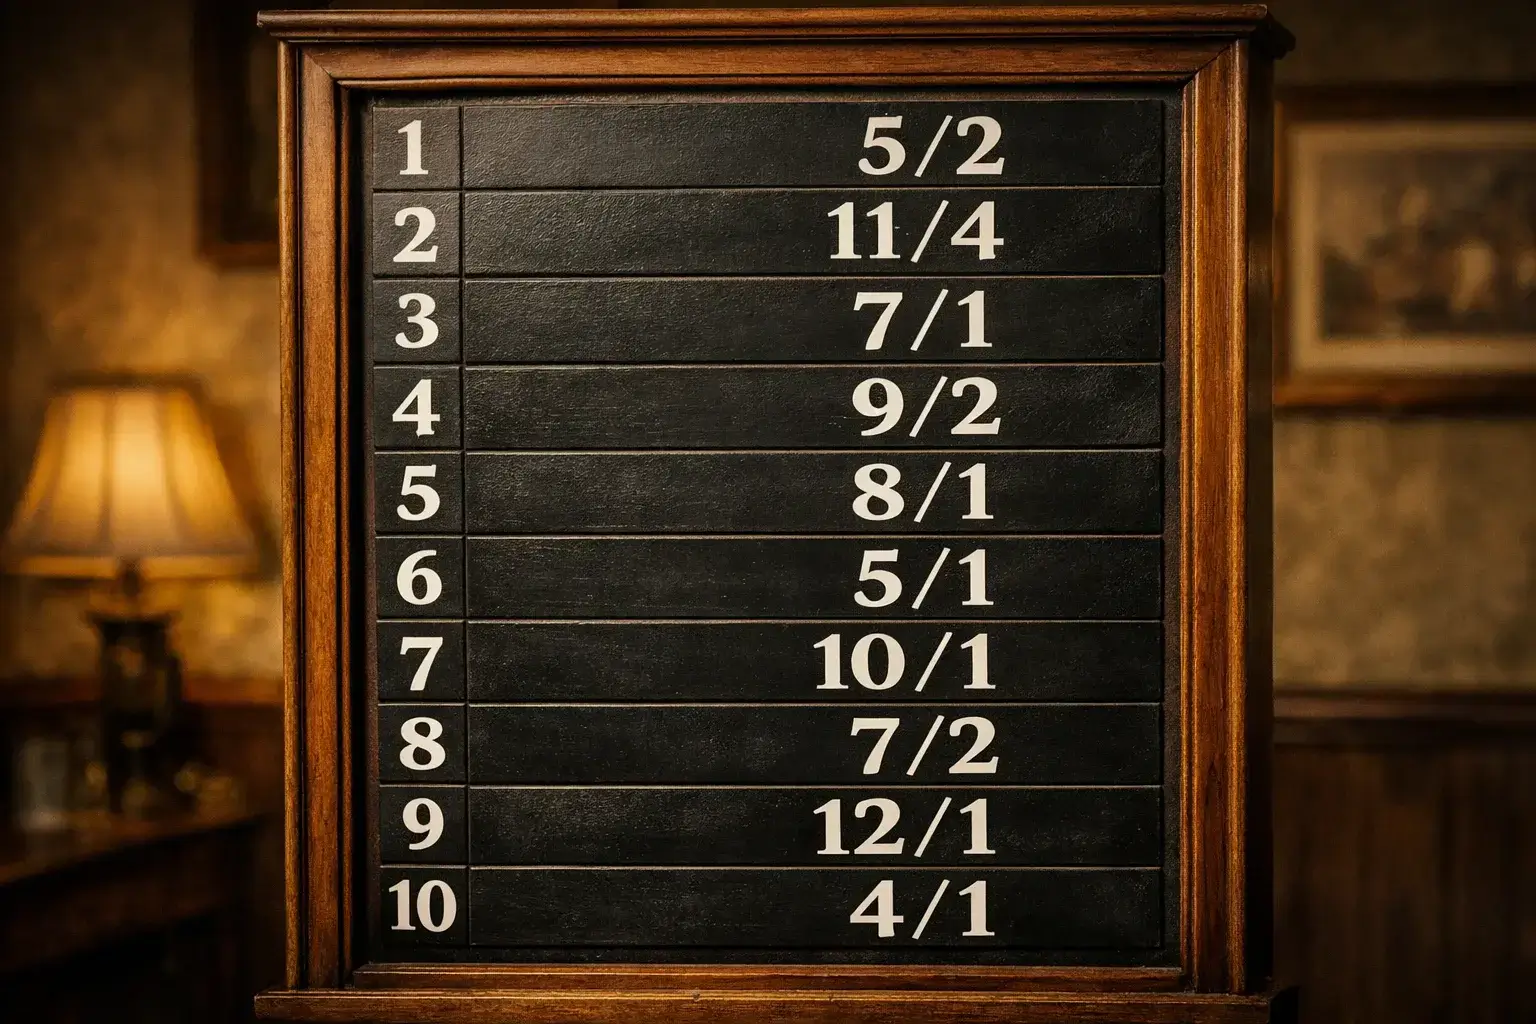
Reading fractional odds requires understanding that the first number represents potential profit and the second represents the stake required to generate that profit. Odds of 3/1 (pronounced "three to one") pay three units profit for every one unit staked, making them equivalent to decimal odds of 4.00. Odds of 1/3 ("one to three" or "three to one on") pay one unit profit for every three units staked, equivalent to decimal odds of 1.33.
Conversion between fractional and decimal formats follows straightforward formulas. To convert fractional to decimal, divide the first number by the second and add 1. For 5/2: divide 5 by 2 (equals 2.5), add 1, giving decimal odds of 3.50. To convert decimal to fractional, subtract 1 from the decimal odds, then express as a fraction. Decimal 3.50 minus 1 equals 2.50, which expresses as 5/2.
Implied probability from fractional odds requires slightly more calculation. The formula divides the second number by the sum of both numbers. For 5/2: 2 divided by (5+2) equals 2/7, approximately 28.6% probability. For 1/3: 3 divided by (1+3) equals 3/4, or 75% probability. These conversions become automatic with practice but initially require deliberate calculation.
American Odds Explained
American odds use positive and negative numbers to distinguish underdogs from favorites. Positive odds show profit on a 100-unit stake: odds of +250 mean 250 units profit from 100 units staked. Negative odds show the stake required to win 100 units profit: odds of -150 mean you must stake 150 units to profit 100 units. This format dominates United States betting markets and appears increasingly in international contexts.
The positive/negative distinction immediately identifies market positioning. Positive odds indicate the outcome is considered less likely than 50%; negative odds indicate greater than 50% likelihood. When both teams show negative odds, the more negative number indicates the stronger favorite. When both show positive odds, the smaller positive number indicates the lesser underdog.
Converting American odds to decimal requires different formulas for positive and negative values. For positive odds, divide by 100 and add 1: +250 becomes 2.50 plus 1, equaling 3.50 decimal. For negative odds, divide 100 by the absolute value and add 1: -150 becomes 100/150 (approximately 0.67) plus 1, equaling 1.67 decimal. These conversions let you compare American odds against decimal odds from other bookmakers.
Implied probability calculation similarly differs by sign. For positive odds, divide 100 by (odds plus 100): +250 implies 100/(250+100) equals 28.6%. For negative odds, divide the absolute value by (absolute value plus 100): -150 implies 150/(150+100) equals 60%. American odds make favorite/underdog identification immediate but require more calculation for probability conversion than decimal odds.
How to Calculate Potential Winnings
Basic Payout Calculations
Calculating potential winnings ensures you understand what you stand to gain or lose before placing any bet. For decimal odds, multiply your stake by the odds to get total return, then subtract your stake for profit. A 50-unit stake at odds of 2.40 returns 120 units (50 multiplied by 2.40), generating 70 units profit (120 minus 50). This calculation works identically regardless of stake size or odds level.
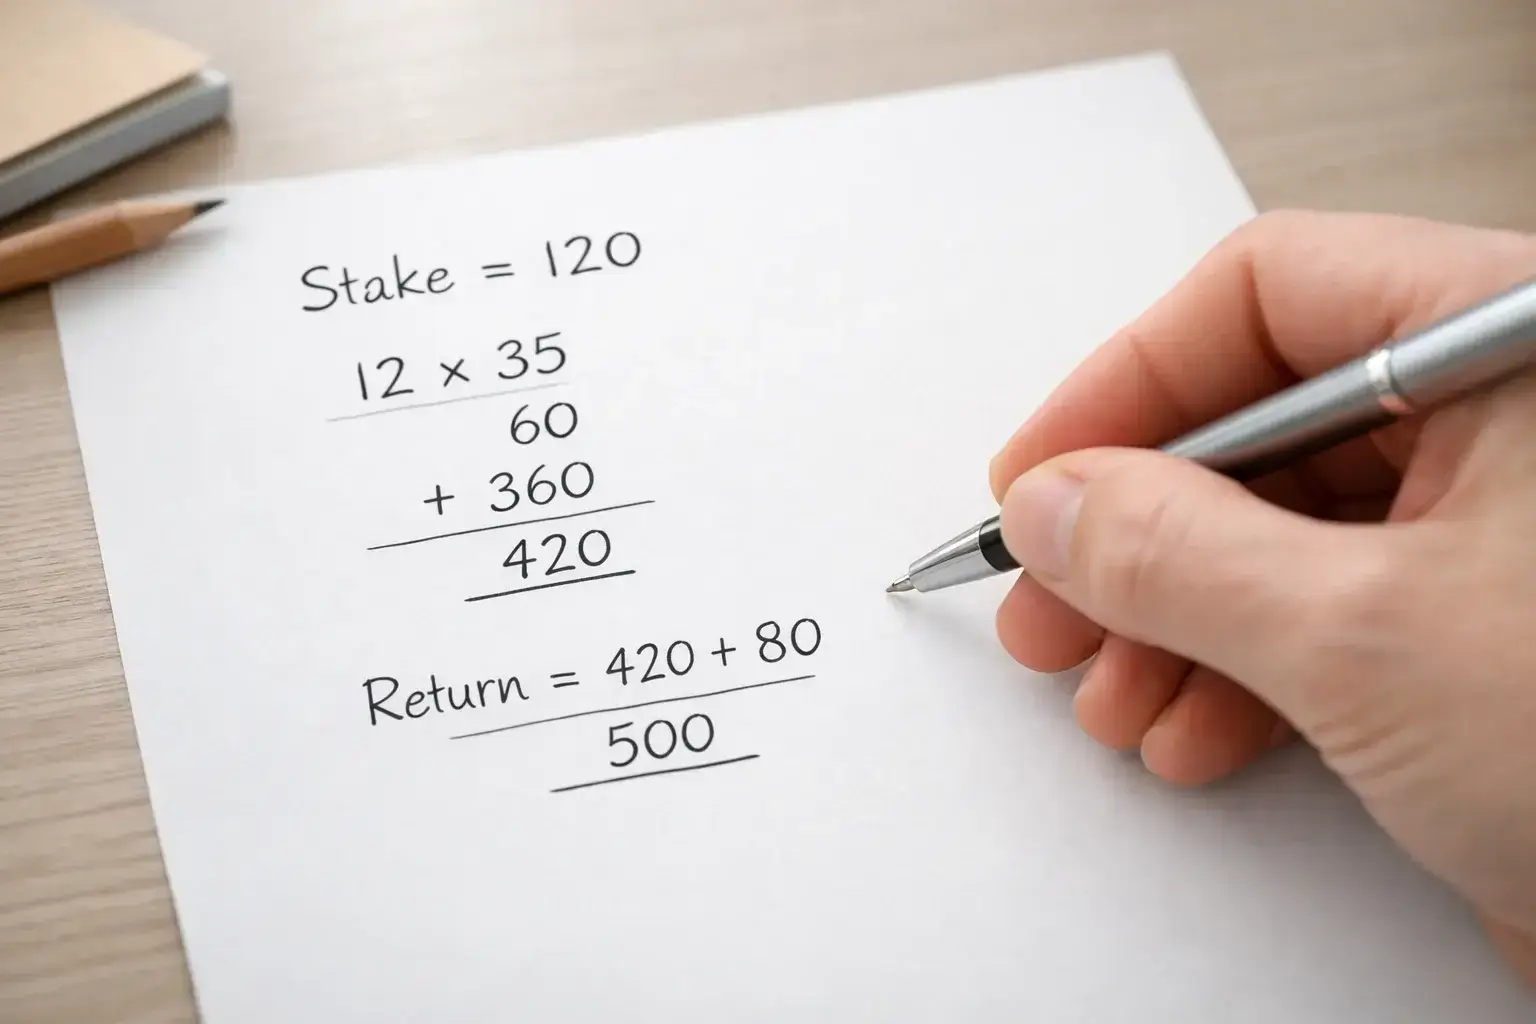
For fractional odds, multiply your stake by the fraction to find profit, then add your stake for total return. A 50-unit stake at 7/5 generates 70 units profit (50 multiplied by 7, divided by 5), returning 120 units total. Alternatively, convert to decimal first and use the simpler decimal calculation. Either approach yields the same answer.
For American odds, positive and negative values require different approaches. With +200 odds, divide the odds by 100 and multiply by your stake for profit: 50-unit stake generates 100 units profit (200/100 multiplied by 50). With -200 odds, divide your stake by the odds divided by 100: 50-unit stake at -200 generates 25 units profit (50 divided by 2). Adding stake to profit gives total return in both cases.
Multiple Bet Calculations
Accumulator bets (also called parlays) combine multiple selections where all must win for the bet to pay out. The combined odds multiply together: two selections at 2.00 and 3.00 decimal create combined odds of 6.00. Your stake multiplied by these combined odds gives total return if all selections win. The mathematical appeal of accumulators is that small stakes can generate large returns; the practical challenge is that the probability of all selections winning decreases rapidly with each addition.
Each selection added to an accumulator multiplies the bookmaker's margin as well as the odds. If each individual market contains 5% margin, a four-selection accumulator effectively faces approximately 20% margin (slightly less due to compound effects, but substantially more than single bets). This compounding margin explains why bookmakers actively promote accumulators: they are significantly more profitable for the house than single bets.
System bets like Lucky 15 or Yankee structures combine multiple accumulators covering different permutations of your selections. These bets can return profit even if not all selections win, but require larger stakes and generate lower returns than equivalent straight accumulators. Understanding exactly which combinations your system bet covers prevents confusion when some selections win and others lose.
Understanding Stakes and Returns
Unit-based thinking helps maintain consistent stake sizing regardless of account balance fluctuations. Define a unit as a fixed percentage of your bankroll, typically 1-2%. A 100-unit bankroll means 1-unit bets risk 1% of total funds. As your bankroll grows or shrinks, unit size adjusts accordingly, automatically scaling bet sizes to your current position.
Return on investment calculations measure betting performance over time. ROI equals profit divided by total staked, expressed as a percentage. Staking 1000 units across multiple bets and finishing with 1050 units represents 5% ROI (50 profit divided by 1000 staked). Tracking ROI by market type, league, or time period reveals where your betting is profitable and where it is not.
Variance affects short-term results regardless of long-term edge. A bettor with genuine 5% ROI expectation might lose money over any given week or month due to unfavorable variance. Understanding expected variance ranges prevents overreaction to short-term results and maintains confidence in sound processes during inevitable losing periods.
Understanding Implied Probability
Converting Odds to Probability
Every set of odds implies a probability assessment by the bookmaker. Extracting this implied probability transforms odds from abstract numbers into claims you can evaluate against your own analysis. If odds imply 40% probability and you believe the true probability is 50%, you have identified potential value. If your probability estimate matches the implied probability, no value exists regardless of how attractive the odds might appear superficially.
The general formula for implied probability divides 1 by decimal odds. Odds of 2.50 imply 40% probability (1/2.50 equals 0.40). Odds of 1.80 imply approximately 55.6% probability (1/1.80 equals 0.556). Performing these calculations for all options in a market reveals how the bookmaker has distributed probability across possible outcomes.
Summing implied probabilities across all options in a market reveals the bookmaker's margin. A fair market would sum to exactly 100%. Actual markets sum to more than 100%, with the excess representing bookmaker margin. A two-outcome market showing implied probabilities of 54% and 52% sums to 106%, indicating 6% margin. Lower margins mean better value for bettors; higher margins advantage bookmakers.
The Role of Bookmaker Margin
Bookmaker margin represents the mathematical edge built into every market. This margin ensures bookmakers profit over time regardless of individual outcomes. Understanding margin helps bettors recognize which bookmakers offer better value and which markets within any bookmaker are priced more or less favorably.
Margin distributes unevenly across outcomes within markets. Bookmakers typically apply more margin to underdogs than favorites, inflating underdog implied probabilities more than favorite implied probabilities. This pattern means favorite odds often offer better value relative to true probability than underdog odds, though specific situations vary.
Comparing margins across bookmakers guides account selection. Bookmakers with consistently lower margins offer better long-term value than high-margin alternatives. Even small margin differences compound significantly over many bets. A bettor placing 1000 bets annually saves substantial money by using lower-margin bookmakers consistently.
True Probability Versus Implied Probability
True probability represents the actual likelihood of an outcome occurring, while implied probability represents the bookmaker's pricing adjusted for margin. The difference between these creates betting value when true probability exceeds implied probability, or identifies bets to avoid when implied probability exceeds true probability.
Estimating true probability requires analytical work that most bettors skip. You might assess team strength, recent form, conditions, and head-to-head records to estimate that Team A has 55% chance of winning. If implied probability from the odds is 50%, potential value exists. If implied probability is 60%, the bet offers negative expected value regardless of whether Team A actually wins.
Calibrating probability estimates improves with practice and tracking. Record your probability estimates before betting, then track how often outcomes you estimated at various probability levels actually occurred. If outcomes you estimated at 60% probability occur 70% of the time, you are systematically underestimating certain types of events. This feedback improves estimation accuracy over time.
Finding Value in Cricket Odds
What Value Betting Means
Value exists when odds offer better returns than true probability justifies. A coin flip should pay even money (2.00 decimal) for either outcome. If a bookmaker offers 2.10 on heads, that represents positive expected value: over many flips, betting heads at 2.10 would generate profit despite heads only occurring 50% of the time. Cricket betting value works identically, though true probabilities are harder to determine than coin flip mathematics.
Positive expected value betting requires finding odds where implied probability understates true probability. If you correctly identify that Team A has 50% chance of winning but odds imply only 40%, backing Team A offers long-term positive expectation. The bet will lose sometimes, even often, but over sufficient repetitions, correct identification of value generates profit.
Value betting differs from simply backing winners. A team might win frequently but still offer poor value if odds are too short. Conversely, underdogs who rarely win might offer excellent value if odds overcompensate for their low win probability. Separating value assessment from outcome prediction represents a crucial conceptual shift for serious bettors.
Identifying Mispriced Markets
Markets become mispriced when bookmaker assessments diverge from true probabilities. This divergence can occur because bookmakers lack specific information you possess, weight factors differently than warranted, or simply make errors that have not yet been corrected through market action.

Information advantages create mispricing opportunities. Local pitch conditions, unreported injuries, or team selection intelligence might inform your assessment before bookmakers fully incorporate this information. As news spreads and markets adjust, these temporary mispricings disappear, rewarding those who acted early.
Model-based approaches systematically identify mispricing by comparing statistical projections against market odds. If your model consistently values outcomes differently than the market, either your model captures information the market misses or your model has systematic flaws. Testing model predictions against actual outcomes reveals which situation applies.
Practical Value Assessment
Assessing value practically requires honest probability estimation without bias toward preferred outcomes. Hoping Team A wins does not make them 60% likely if objective analysis suggests 45%. Separating fandom from betting analysis prevents emotional probability inflation that destroys value-seeking efforts.
Confidence levels affect appropriate responses to perceived value. High confidence that your probability estimate exceeds the market's might justify larger positions. Low confidence that value exists might suggest smaller positions or passing entirely. Matching position sizing to confidence prevents overcommitment to marginal opportunities while allowing aggressive action on clear value.
Tracking results by perceived value level validates your assessment process. Bets you believed offered strong value should outperform bets you believed offered marginal value over time. If marginal-value bets perform better than strong-value bets, your value assessment is miscalibrated and needs adjustment.
Odds Comparison Strategies
Why Line Shopping Matters
Different bookmakers offer different odds on the same events because each maintains independent pricing models and risk positions. Taking the best available odds rather than accepting whatever your default bookmaker offers improves returns without requiring any change in selection quality. This practice, called line shopping, represents one of the simplest ways to improve betting results.
The impact of line shopping compounds across many bets. Capturing an extra 0.05 in decimal odds per bet seems trivial, but across hundreds of annual bets, these improvements sum to meaningful return differences. Professional bettors universally practice rigorous line shopping; recreational bettors rarely bother. This difference partially explains outcome differences between these groups.
Maintaining accounts with multiple bookmakers enables effective line shopping. The operational cost of managing several accounts is minimal compared to the value captured through better odds. Prioritize bookmakers with competitive odds on markets you frequently bet, accepting that no single bookmaker leads across all markets.
Using Odds Comparison Tools
Odds comparison websites aggregate pricing from multiple bookmakers, showing best available odds for major markets. These tools dramatically reduce the time required to identify optimal prices compared to checking each bookmaker individually. Most comparison sites cover major cricket betting markets comprehensively.
Comparison tools have limitations worth understanding. They may not update instantaneously as bookmakers adjust prices, creating potential discrepancies between displayed and actual odds. They typically cover headline markets more comprehensively than niche propositions. They may not include all bookmakers available in your jurisdiction. Using comparison tools as starting points rather than complete solutions accounts for these limitations.
Mobile comparison apps enable line shopping during live betting when speed matters. Checking multiple apps quickly while odds move requires practice but captures value during volatile in-play periods that desktop comparison cannot match.
How Odds Change Before and During Matches
Pre-Match Odds Movements
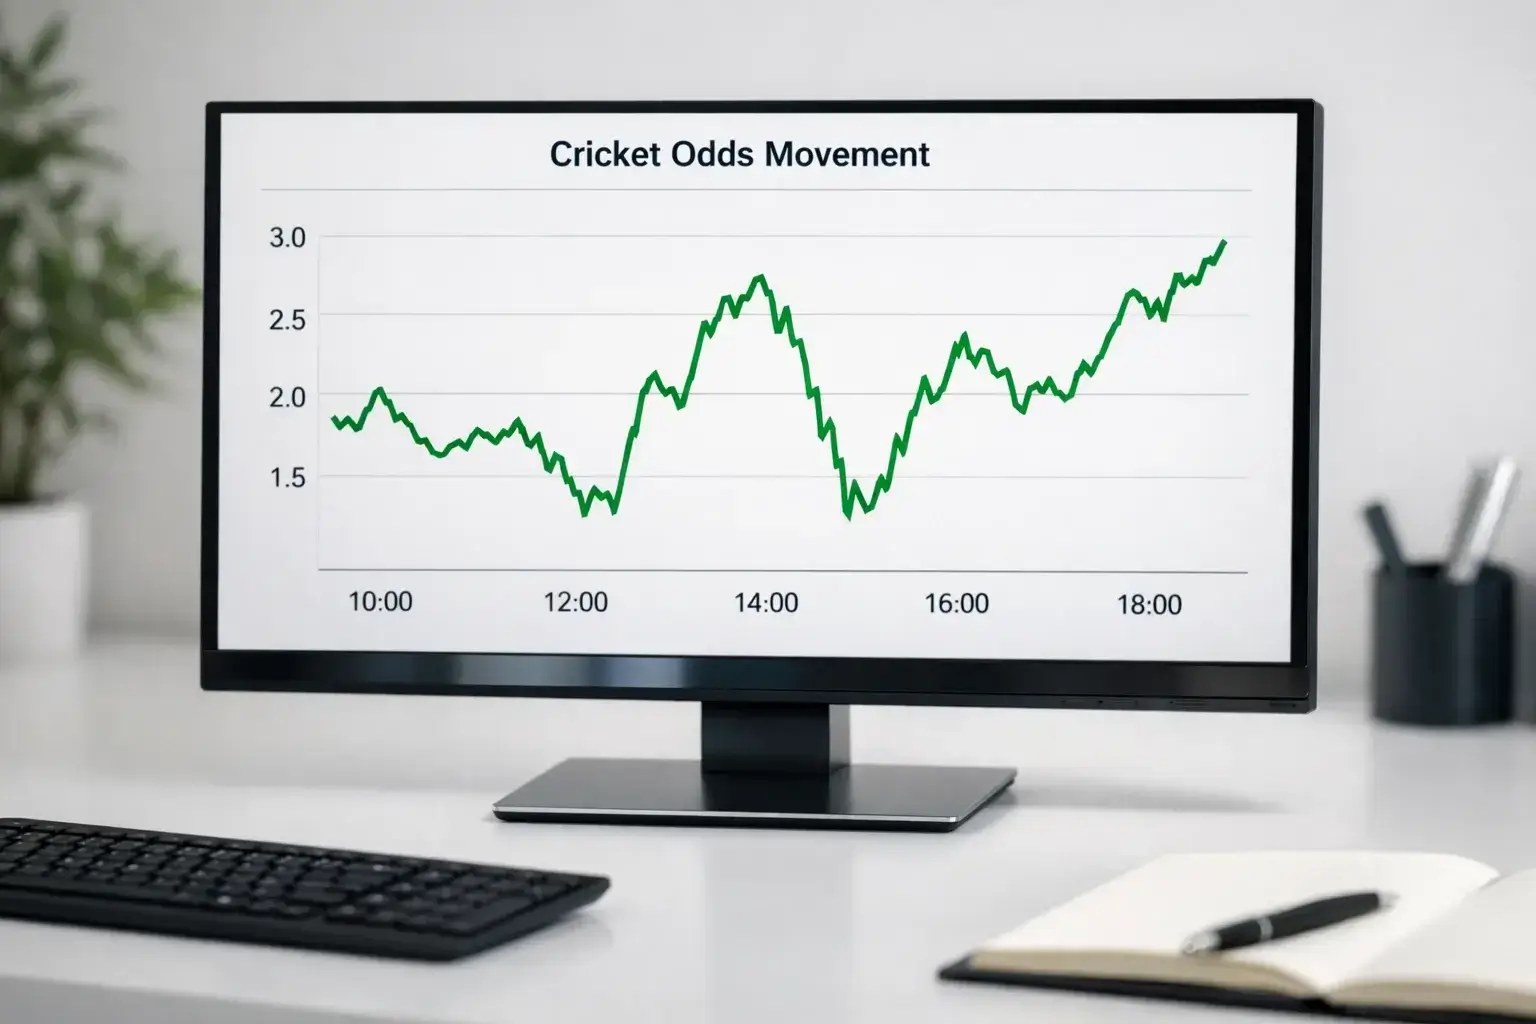
Cricket odds open when bookmakers first price matches, typically 24-48 hours before start time, and move continuously until the match begins. Initial prices reflect bookmaker models incorporating historical data, recent form, and available team news. Subsequent movements respond to betting volume, new information, and competitive pressure from other bookmakers.
Sharp money from sophisticated bettors moves markets rapidly. When significant volume arrives at specific prices, bookmakers assume informed money is acting and adjust accordingly. Following sharp money is difficult because by the time movement is visible, the opportunity has typically passed. However, noting which direction sharp money moved on past matches can inform future assessment of similar situations.
Late team news drives substantial pre-match movement. Injury announcements, lineup revelations, or condition updates all prompt rapid repricing. Bettors with faster access to this information can capture value before prices fully adjust. Most recreational bettors lack information advantages, but understanding that others have them explains otherwise puzzling price movements.
Live Odds Dynamics
During matches, odds respond to every significant event: wickets, boundaries, milestones, and momentum shifts. The magnitude of response reflects the event's importance and how much it changes the expected outcome. A star batsman's dismissal moves odds more than a tail-ender's departure because it has larger implications for the likely result.
Live odds incorporate anticipatory adjustments, not just reactive ones. If a batsman reaches fifty, odds might shorten for their team even though the score has not yet changed much, reflecting increased probability of a large score from that set batsman. Similarly, threatening weather might prompt odds adjustments before any rain actually falls.
Market suspension during live betting prevents exploitation of broadcast delays. Bookmakers suspend markets during each delivery, reopening afterward with adjusted prices. Understanding suspension patterns helps live bettors anticipate when markets will be available and when rapid price changes are likely to occur.
Using Odds Movement Information
Odds movement reveals market sentiment and can inform betting decisions even when you do not act on the moving market. If odds for a team shorten significantly without obvious news, the market has received information or analysis suggesting that team is stronger than initially priced. Whether to follow this movement or fade it depends on your assessment of your own analysis versus the market's collective wisdom.
Tracking your pre-match odds against closing odds reveals whether your early bets captured value or gave it away. Consistently betting on selections that strengthen toward close suggests you are identifying value before the market does. Consistently betting on selections that weaken suggests your analysis lags market efficiency. This comparison provides valuable feedback on betting timing.
Closing line value has become a key metric for evaluating betting skill. Beating the closing line means your bets were placed at better prices than the final market price, indicating your assessment led the market's assessment. Long-term positive closing line value correlates strongly with long-term profitability, making it one of the best predictors of betting skill.
Conclusion
Understanding odds transforms cricket betting from guesswork into analysis. The ability to convert between formats, calculate potential returns, extract implied probabilities, and identify value opportunities provides the foundation for informed betting decisions. Without these skills, even excellent cricket knowledge fails to translate into betting success because you cannot recognize when the market has mispriced your insights.
Odds mastery develops through practice and deliberate attention. Convert odds to implied probability until the process becomes automatic. Compare your probability estimates against market implications before every bet. Track whether your perceived value actually materializes in results over time. These habits embed analytical thinking into your betting process.
The market for cricket betting is not perfectly efficient, but it is efficient enough that casual approaches consistently lose money. Understanding odds deeply is necessary but not sufficient for long-term success. Combining odds literacy with genuine cricket knowledge, disciplined bankroll management, and continuous improvement creates the possibility of sustainable edge. The odds themselves will tell you whether you are succeeding, if you know how to read them properly.
